4 Pillars of Observability
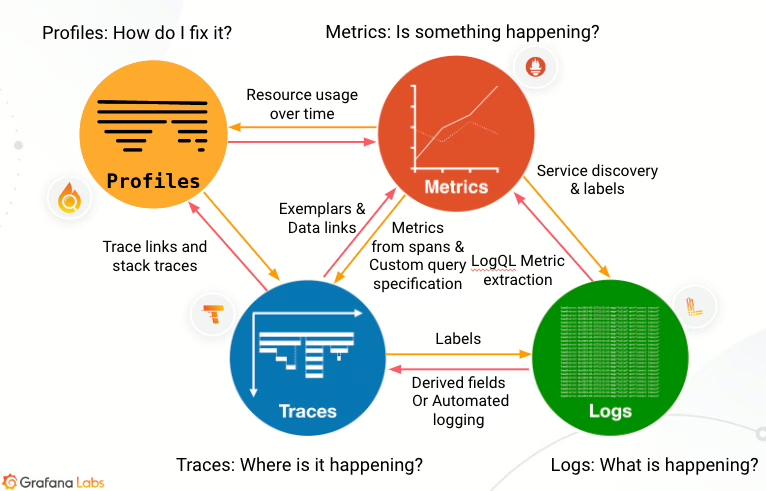
As systems grow in complexity, performance issues creep into application over time. Debugging such issues is often difficult as these are the result of amalgamation of multiple causes. Observability plays an important role in pinpointing these causes. Traditionally, there are 3 pillars of observability: logging, tracing, and metrics. The 3 pillars of observability greatly improve visibility into the system’s status, health, and bottlenecks. However, sometimes these are not enough, sometimes there needs a visibility into how exactly how much time each code takes up.
This is where the 4th pillar of observability: continuous profiling, comes into play. Let’s explore Async-profiler; a popular profiler for Java, with example project in order to find out how profiling provides additional layer of visibility.
Async-profiler
Async-Profiler is a low-overhead sampling profiler for Java that leverages HotSpot API to collect performance data. It supports profiling of both Java and non-Java threads, including GC and JIT compiler threads, and can capture native and kernel stack frames.
Key features include profiling CPU time, Java heap allocations, native memory usage, and lock contention. The profiler works with OpenJDK and other HotSpot-based JVMs and outputs results as interactive flame graphs or other formats, making it easy to analyze performance problems in production environments. GraalVM native images are not supported as they lack necessary APIs.
Installing

Download links are provided directly in Async-profiler Github page. Extract the downloaded file.
Profiling In Local Environment
For the profiling demo we’ll use example project provided by spring boot guide . Clone the repository and run Spring Boot Application. The application will start listening on port 8080.
⚠️ My local machine is running macOS. But the same commands will probably work in Linux.
$ git clone https://github.com/spring-guides/gs-spring-boot.git
$ cd gs-⚠-boot/complete
$ ./gradlew bootRun

> Task :bootRun
  .   ____          _            __ _ _
 /\\ / ___'_ __ _ _(_)_ __  __ _ \ \ \ \
( ( )\___ | '_ | '_| | '_ \/ _` | \ \ \ \
 \\/  ___)| |_)| | | | | || (_| |  ) ) ) )
  '  |____| .__|_| |_|_| |_\__, | / / / /
 =========|_|==============|___/=/_/_/_/

 :: Spring Boot ::                (v3.3.0)
...
...
2025-06-03T21:16:30.156+09:00  INFO 84975 --- [           main] o.s.b.w.embedded.tomcat.TomcatWebServer  : Tomcat started on port 8080 (http) with context path '/'
2025-06-03T21:16:30.165+09:00  INFO 84975 --- [           main] com.example.springboot.Application       : Started Application in 0.768 seconds (process running for 0.88)
Check the application is running correctly by calling on it’s root path.
$ curl localhost:8080/
Greetings from Spring Boot!%
Find pid of the Spring Boot Application. You’ll need as an argument for Async-profiler.
$ lsof -i :8080
COMMAND   PID    USER   FD   TYPE             DEVICE SIZE/OFF NODE NAME
java    84975 sangmin   42u  IPv6 0x10f5660110596021      0t0  TCP *:http-alt (LISTEN)
Now let’s profile this application using Async-profiler downloaded and extracted from previous step. Run the following command.
# head to the extracted async-profiler dir

# -d : duration - run profiling for <duration> seconds
# -f : filename - dump output to <filename>
$ ./bin/asprof -d 30 -f flamegraph.html <YOUR_PID>
Analyzing Flame Graph
Open up flamegraph.html and you’ll be greeted with a flame graph of CPU profile.

Flame graph is a visualization of hierarchical data created by Brendan Gregg. It is often used for performance analysis of software, as it provides a visual representation of stack traces over time. In a flame graph, each box represents a function in the stack, and the width of the box corresponds to the amount of time spent in that function and its children. This allows developers to quickly identify performance bottlenecks, such as functions consuming the most CPU time, by locating the widest (hottest) parts of the graph.
There is a fantastic video on how to interpret flame graphs by Brendan Gregg himself, so do check it out.
Profiling Mock Scenario
The spring application is basically doing nothing now, so that flame graph is pretty useless. Let’s set up a mock scenario to find out application bottleneck using flame graph. The code is pretty self-explanatory.
@RestController
public class BottleneckController {

    static final int MAX_ELEMENTS = 100_000;

    @GetMapping("/bottleneck")
    void bottleneck() {
        // Simulate a bottleneck by performing creating and adding many elements to a list
        var list = new ArrayList<Integer>();
        var num = 0;
        while (true) {
            if (list.size() >= MAX_ELEMENTS) {
                sleep();
                list = new ArrayList<>();
            } else {
                list.add(num);
            }
        }
    }

    private static void sleep() {
        try {
            Thread.sleep(100);
        } catch (InterruptedException e) {
            throw new RuntimeException(e);
        }
    }
}
Call /bottleneck API and profile the application again, then open the output file. The flame graph is a lot more interesting this time. You can see tall and wide stack trace to the BottleneckController.

If you look closely at the BottleneckController, you can see that large part of its stack trace is taken up by Arrays.copyOf.

Since the code has not specified the initial capacity of the list, it is dynamically resized as elements are added. During this process, elements are copied to a new array. That’s something we can optimize; simply assign initial capacity as we already know the exact size we need.
@RestController
public class BottleneckController {

    static final int MAX_ELEMENTS = 100_000;

    @GetMapping("/bottleneck")
    void bottleneck() {
        // Simulate a bottleneck by performing creating and adding many elements to a list
        // set initialCapacity to list
        var list = new ArrayList<Integer>(MAX_ELEMENTS);
        var num = 0;
        while (true) {
            if (list.size() >= MAX_ELEMENTS) {
                sleep();
                list = new ArrayList<>(MAX_ELEMENTS);
            } else {
                list.add(num);
            }
        }
    }

    private static void sleep() {
        try {
            Thread.sleep(100);
        } catch (InterruptedException e) {
            throw new RuntimeException(e);
        }
    }
}
And now Arrays.copyOf is completely gone.


Profiling Modes And Outputs
We’ve only looked at CPU profile so far, but Async-profiler provides profiling modes to profile other events as well. https://github.com/async-profiler/async-profiler/blob/master/docs/ProfilingModes.md
| Mode | Trigger/Event | Description | Useful For |
|---|---|---|---|
| CPU | cpu (default) | Samples call stacks using perf_events + AsyncGetCallTrace. | Java & native code performance |
| Wall Clock | wall | Samples all threads periodically, regardless of state. | Startup time, blocked/sleeping threads |
| Allocation | alloc | TLAB-driven sampling of heap memory allocations. | Memory pressure, allocation hotspots |
| Lock Contention | lock | Samples lock acquisitions and time spent waiting. | Lock contention & thread blocking |
| Multiple Events | -e cpu,alloc,lock | Profiles multiple events simultaneously (output: .jfr only). | Comprehensive profiling |
| All (Preset) | --all | Enables cpu, wall, alloc, live, lock, nativemem. | Full-spectrum profiling (dev use preferred) |
Output formats other than flame graph html are provided as well. https://github.com/async-profiler/async-profiler/blob/master/docs/OutputFormats.md
| Format | Description | Visualization / Use |
|---|---|---|
collapsed | Semicolon-separated call stacks with counts | Input for generating FlameGraphs via FlameGraph script |
flamegraph | Interactive, hierarchical call trace visualization | Color-coded SVG; visual flame graph in browser |
tree | HTML tree view showing resource usage in descending order | Expandable call stacks in HTML format |
text | Default format showing sampled call stacks in plain text | Human-readable plain text format |
jfr | Binary format compatible with JDK Flight Recorder | Visualize with JDK Mission Control, IntelliJ IDEA, etc. |
Continuous Profiling In Production
Why Continuous Profiling Matters
So why continuous profiling? Isn’t just profiling enough? Even with the profiling and flame graph, it becomes quite difficult to pinpoint the cause of a performance problem. This is because every profiling results are unique to its system. Having the some method taking up 5% of total result, has different meanings in different systems, everything is relative. That is why you need to compare a profiling result of a system to a previous one. And for previous result to exist when one needs it (ie. when performance issue arises), continuous profiling needs to be in place.
Integrating Continuous Profiling
There are multiple ways to integrate Async-profiler to production environment. The easiest way to integrate without affecting application code is to launch profiler as a java agent. A Java agent is a special type of Java program that can be loaded into a Java Virtual Machine (JVM) to modify or augment the behavior of other Java applications running within that JVM.
Use libasyncProfiler.so agent with loop option to implement continuous profiling. The agent is included in the downloaded file from installation process under /lib directory.
# loop=TIME - run profiler in a loop (continuous profiling)

$ java -agentpath:/path/to/libasyncProfiler.so=start,event=cpu,file=/path/to/profile-%t.jfr,loop=10s
Check available agent arguments here. If you are containerizing you application, you can either include the .so file during container image build or provide it using volume of you choice. The output file should also be persisted using a persistent volume of your choice.
Continuous Profiling Solutions
With manual configuration of continuous profiling using a java agent, developers have to 1) inject java agent .so file, 2) persist output files, 3) use some client to compare profiling output files. Lots of observability tools nowadays provide continuous profiling as a service, so you don’t have to implement it yourself. Just provide tool specific agents using either java agent or sidecar, and the tools will provide ingestion of profiling output, and UI to compare them. These tools typically use Async-profiler under the hood, so you can utilize what you learned here today to configure these services to your needs.
Some continuous profiling solutions(ex. Datadog) provide additional integration with code version control systems to event display exactly which code the stack trace originated from. This comes in handy when debugging performance issue introduced by the new version of your application. Below are some of the solution built on top of Async-profiler
Datadog
Datadog Continuous Code Profiler

Grafana Pyroscope